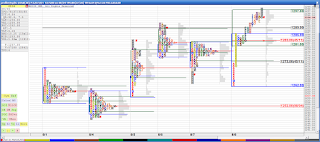
The market has been exhibiting price and volume behavior that represents buying by longer time participants for the last few weeks. There is evidence from prior weeks, but lets look at the last 6 days market profile of the S&P Emini futures september contract which provides a good perspective of what undercurrent was flowing in the market in those sessions.

Starting from the sell off on 8/1 that formed a b pattern in the market profile below, indicating longer term buyers absorbing the sell off. Price balanced on 8/4 forming a wide D shaped distribution. We gapped open higher on 8/5 and the double distribution on that day indicated multiple timeframes buying. On 8/6 we balanced again with continued buying in the afternoon. On 8/7 the short term positions sold off on financials weakness and news. Buyers continued to absorb the sell off through out the day and through late in the day, when the market sold off after establishing value higher in the 1274-1283 range for much of the session. What looked like a weak market on price alone, had infact become a very dangerous market to be holding a short position not only based on the p formation and narrow distribution ( in fact a single tail ) sell off, but along with the Bid/Ask Volume analysis for the session and inference from past few sessions.
Before the bid ask analysis lets take a look at the 180 minute chart below for the ES. Most of you are aware of the ascending triangle that had been developing.

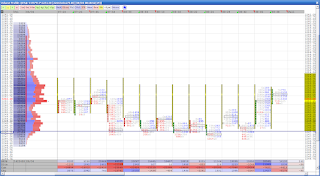
Now lets look at the orderflow at the key test of the lower line of the triangle 0n 8/4. The chart below is a bid ask analysis chart set at 7 ticks reversal from Market Delta. For those who are not familiar with it, it takes the price to reverse 7 ticks in the opposite direction of the prior column to draw a new column. The red numbers are trades at bid and blue numbers are trades at ask. Simple enough. Oh, btw theses are transacted trades, not bids and asks ( that may or may not be transacted at all, like on a dome).

At 7:50 PST the price came down on very heavy selling to 1247.50. Notice at 47.75, 48.00, 48.25 and 48.50 we have a huge numbers of sellers but there were enough limit buy orders that got reloaded several times in the 10 minutes of battles that stopped the fall. It was not that we did not have enough sellers, but the price was of interest to some buyers who were buying for perhaps a different time frame. While this data is not enough to make a trade yet, the subsequent price probes show similar patterns. By 8:32 PST it was clear that there were more buying interest in those probes then selling pressure. Also at that point the NYSE TRIN and other markets were divergent. More importantly, 1247 was also a volume POC (point of control) on 7/29 which was the base (support) of the last up move and the support held.

The most interesting thing about 8/4 day however, was how it closed. It settled about 10 points to the downside but with a net positive of 16K delta (a significant delta divergence). Notice the late afternoon buying, a sell off ( mostly short term traders) then again limit buying in the 1247 area. Such days are indicative of program buying. Best buyside brokers bottom feed without showing their hands.
One can argue that strictly from a price perspective it was a negative close. However the underlying data in other dimensions hinted a possibility of a reversal from this prior support. Like the prior session, it was the kind of day when it was not advisable to take a short home.
On 8/5 we gapped higher. And it became evident that paper came in on the buy side. As we tested the now resistance (prior support) of 1265, notice how every attempt to sell are absorbed by the resting bids before it finally breaks through on heavy volume. This is FOMC day and the buying continued through the close.

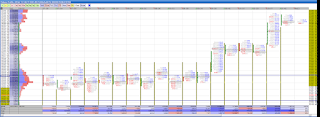
In the afternoon session on 08/05 the same behavior continued although it might have looked like a weak top till about 7:41 PST on a price chart. The bid ask profile below show the true undercurrents as the market consolidates to test and break out from the 1276 area. Notice the unusually high amount of selling absorbed in the 1265 area and the value area and mean shifting upwards ( the gold bar is value area and bright gold spot is mean), while the price rotated around this area.

The same conditions occured on 08/06 as price consolidated in the 1280-85 area leading to the break out.

It then balanced on the 08/07 as short term profit takers sold to longer term buyers. US consumer credit data led to an afternoon sell off by short/intermediate term holders forming a p pattern again the market profile.
The market openned the next day on 08/08 and rallied back to the value of previous day as these weak shorts covered. And the buying continued through out the day as we busted through the 80s to the crucial 1290s.

In the top picture of Market profile for the last few sessions the uptrend days has well spread out distribution as price found acceptance higher. This is indicative of multiple timeframe participants in the market. If we look at other markets such as commodities ( the fall of crude and gold in particular), and the strength of US dollars in the recent times, it could be inferred that there has been major repositioning of capital in recent times. Perhaps markets are at the end of a beginning in the change of flow of capital . In other words the first waves of big money has already crept in -quitely.


4 comments:
Brilliant post, looking forward for more to come!
Waw, excellent post !
Hi Surarel,
Great analysis. Could you please explain what the olive green bars represent?
Thank you, best trading,
Jorge
thx @ mr.trade & Chahid
Firebird,
the green olive (or gold bar as I refer to in my edits to the post) is the developing value area. Or 70% of volume distribution. Bight spot is the mean.
thanks for visiting.
Post a Comment