Wednesday, October 8, 2008

End of B period


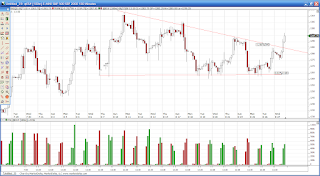
There a lot of paper buying today. 50K positive delta on the big size lots. We do need to hold this vwap area within this area. Lot of volatility and risk of getting chopped. We havent seen any strength until today after the break down of the 1140 area. Still a very weak market in the near term.

Wednesday, October 1, 2008

Delta positive at the top of the hour


Just like yesterday we have additional buying at these levels. Rarely you see a positive delta near the lower 2nd deviation of VWAP as seen in the B & C period today.
Remember that yesterday was an inside day. Finally we have some semblance of normal trading. However the volatility is in wait and come in at anytime a significant break in news surfaces. So the key is to be careful. Prior sessions has been very choppy on the profitability front. I remember a short that stopped me out at entry by 2 ticks and dropped like a rock and then Doc posts the perfect post.

Dips can be bought today if the financials continues strengthen. The inside day breakout is a small small possibility but until the end of lunch time we might not see the volume. Currently, it is not supportive of that bias. we could simply rotate and balance inside until the news (higher probability).

Tuesday, September 30, 2008

A different mood


Todays market mood is opposite of yesterday before the failure of the bailout vote.
Note that the market had a bid delta negative. Today we are the opposite: 52K positive delta indicating covering and over 30K positive on the big delta. Financials are balancing as well and the PNF chart is not trying to make new directions. Market is comfortable here for today until the next directional news. VWAP provided two small buying opputunities and the price action is not too volatile. Careful of any whipsaws if there are any political comments or consensus. Time is running out.

Monday, September 29, 2008

Bailout woes

Market tanks on possibility of a rejected bailout package. DJ down 700 points.
Rescue plan fails vote.

Bottom of the hour


Lunch time! The S&P emini has indeed mananged a flush move to the downside. And we are at the support level of the 1160s. There were some buy response that came in at 9:28 and 9:33 PST in the chart below. Selling pressure has subsided and at the POC of the day we have a 2 way auction with some shorts covering. Note the delta is at -55K.

The 1180 area is key as it is VWAP, Dev VAH as well as a minor resistance today. This flush move to the downside gobbles up any long position from the 1160s from last week and prior session. An action market makers and locals love to orchestrate. Financials are still drag until now. We need financials to turn around significantly less than 2 hours for a true reversal. Regardless of indented direction there is a high likelyhood of price whipsaws. Given the negative delta we are at. We need a significant amount of covering and buying for a reversal. Currently, odds favour resistance at VWAP. If we get to VWAP it will be the nature of the buying or covering that determines the conviction. A significant volume in covering may change the game. So far though the big contracts are still -18k negative.

White house announces that they have enough votes for the bailout.

Friday, September 26, 2008

A market in wait


The last two sessions has been balancing in a 20 point value area which is a break from the volatility. The 1225 level in the S&P 500 Emini is holding as a price rejection level. The market spent a lot of fuel yesterday on the buy side without getting much liftoff early on. That is a sign of temporary price acceptance of multi-time frames. Everybody is waiting on the word from the Hill on the bailout package. The market is preoccupied. There is still sign of mild accumulation as we entered the mid morning net delta positive. A moderate sign of price getting some responsive buyers. We are building additional TPO count in the upper distribution of the 3 day profile. Key area to watch is again- the 1225 and the 1187-1191 area overnight. Key to trading days like these is not to get killed by a thousand pricks. Taking very selective 2-3 trades and living with it. I was biased to the upside based on the delta but we did not test the 1225 level although we rotated through yesterday's value. The market just does not have the ammo quite yet. As we have seen in the past few sessions, any strong move in either direction will be preceded by a strong flushing move in the opposite direction. Sometimes small time players like us need to stay out.

Thursday, September 25, 2008

A Trend following the Balance


A trend following yesterdays balance. We are 83K net positive on the Big contracts and 93K in general. Indicating a strong potential for more upside.

Wednesday, September 24, 2008


A balanced day so far. No sign of upward rotation as the big contracts are net negative and the general market is neutral. Good trading oppurtunity in the K period on the weakness of the test of the I period high. Having seen the late afternoon liquidations so far and the distribution yesterday, which was an multitimeframe liquidation as evident in the distribution, one should be poised in the direction of todays balance. The market is probably not going to commit until the bailout is clear. The direction from this distribution today may set the direction. You want to in that direction.

Monday, September 22, 2008

Day type in trading plan


Here's todays profile. Notice the sharp downturn in IB both in the profile and in volume of the dominant flow as well in the direction. The PNF chart also had a down sloping angle through the morning. It was profitable day turned into a loser. I write this blog to bring up the point of incorporating the day type into the trading plan. And outside of value analysis, one needs to set aside days like the sessions we have had - then have a playbook for it. Did you notice the financial's steep down trend. I dont remember it turning around. So you can call it - special exception session - open below value etc. Price never closed above VWAP or the volume weighted moving average. The important sectors to watch were the commodities, the financials, the uncertainty of the bail out program. And how that played in the traders minds. The big contracts actually were buying below VWAP and net positive. The day intended to balance today - but capitulated in the L period. The mistakes in trading are made when one fails to recognize that the opposite flow has won out. It does seem like an excess low, however. An inevitable rotation down when price spends so much time below the POC at the bottom. Tommorows open and the price behavior at the settlement will determine the type of day. Look for long term players to be responsive at the settlement or todays (as well as overnight) LOD.

Clearly, financials and the bailout program needs to be watched intently.

Thursday, September 18, 2008

A day to remember


Palpitating fear in the market after initial balance. Great deal of volume. The Market structure (normal variation) we had yesterday extended with the range extension to the down side in the morning. It is an important detail to note that we had a buying tail in the G & H period. An important level for the future.

Markets rebounded first with the British Financial Services Authority put a temporary ban on betting on the short side. Wide speculations of a cross -border effort with many centralbanks. Then we had news of Paulson talking to lawmakers on a proposal to deal with the bad debt losses:

The U.S. Treasury Department and Federal Reserve declined to comment on Thursday on any discussions Treasury Secretary Henry Paulson may have had with lawmakers about a Resolution Trust Corporation-style fix for a financial market crisis.

"We're not going to comment on rumors," Treasury spokeswoman Jennifer Zuccarelli said.

A congressional aide told Reuters that Paulson has been discussing with lawmakers a proposal to create an entity to deal with bad debt that would be similar to the institution established in 1989 to clean up massive losses in the savings and loan industry. (Reporting by Mark Felsenthal; Editing by Dan Grebler)


A great trading day. Cutting losses quick (or breakeven) and letting runners run
works like a holy grail on days like these. One could rake in a huge profit with less than 50% win rate.

We ended up with a net negative delta of -50K in the genenral chart which indicates that short covering led the rally and some of the long term longs that were liquidated today were not put back on. The big contracts ended up with a positive delta and is in line with the last 3 days action by the big money.

Wednesday, September 17, 2008

Moment of truth

We are here at the moment of truth whether this probe is going to hold. Many attempts to break the downside has not garnered the interest of big initiative sellers. The bigs delta is now net negative which led to the break down of the structure. So far the 60s are still holding. A failure of this probe will be significant for the strength of rotation upwards. Heres the PNF. If this probe does fail we need a big buy response to confirm the support. The buy response did not follow through during the prior probe of the 80 level. We need a much bigger volume than the prior upmove.

At the bottom of the hour


Its 10:24 PST. Traders are getting back from lunch. We have turned from a net negative -15K to +13K in the big contracts. I am concerned a little bit about the market structure. After the C period extension, we havent traded into IB and we are forming a distribution in the bottom, indicating that the auction has brought more timeframes in play. The AIG bailout did not have much play today, at least not much that is visible. Lots of trading oppurtunities and nice fluid moves. The range extension to the downside has been consolidating with some buying interest in the 60s till now.

A day like this, a change of trading style is needed imo. Using shorter time frames in the extremes and looking for conviction in the direction of the moves.

Tuesday, September 16, 2008

Mood of the market


Floor traders often talk about the mood in the pit. It is gauge of what the intended direction of the market is. An invaluable barometer in trying to understand what might unfold. In probability terms it is a bias in the dice. If you have been watching the last two sessions, you are aware of the overwhelming negative news that has come out of the financials . What has been surprising to me is that an analysis of the big contracts is yielding a bias on accumulation. It does not mean that this is the floor of the downleg. However it is clear that these levels are of interest to some long timeframe investors. There are buyers who are willing to be responsive players at these levels. That I think has been a small bias in the dice.

What did not happen yesterday? Yesterdays market structure was an even distribution. No broad based selloff. The big contracts were delta positive through the day. The imminent selling came as a tail in the M& N periods. The bias of the dice caused the structure to be balanced yesterday.

Today the dominant flow from the 60s found intense buying interest at these levels. However later in the day, these buyers did not initiate trades above certain level (mild initiative buying and mostly short covering only)

Yesterday and today are fairly similar in sense of mood. Gloomy but bottom feeding for another day in the future. Currently the 70s and 80s are valuable commodities. If you do not have volume analysis, you can get similar sense of buying with VWAP.

While the general market had been negative, look at the big contracts. A very different picture indeed emerges. A valuable clue in placing trades, making you alert of a possible surprise around the bend.

At some point soon in the future. I intend to post the market bias comments earlier in the morning. Hopefully that will help other traders.


Thursday, September 11, 2008

Surviving the market cycle and profiting from it.


Heres the daily market profile for the S&P 500. Trading the ES emini is probably the hardest job in the world. It is also the best job. Besides being heir to an oil field today. Dare I say that. But if you bought anywhere in the A, B or C period and held it till the N period or overnight, trading 5 contracts or less, I will officially award you the "tradersteetime knighthood" of trading. I have looked up the definition of day trading to see if they include holding a runner for a swing trade. They don't yet. But the market does not give very many opportunities like today for a swing trade.

Today was one of the easiest map and the probability played in our favor. However it was also one of the hardest to hold the winner. Now with 10 contracts and above, I would say it is possible to ride it out with runners. The contract rollover split the volume and that played havoc in volume analysis too. We did get the short squeeze in the end and the ride through the neck of the distribution was really nice. You should have seen the tape.

Now that we are finally in the upper distribution the test of the support below is the key event to observe for any clue where it finds value. Keep in mind the strength of the dollar is reaching forcing points of many inventories. Anybody held the gold short? - you are knighted.

Finally the squeeze - a pictures worth a thousand words. Before I forget, congratulations we survived doomsday.


Prayers and remembrance on September the 11th. Jupiter -may you rest in peace and always in our hearts.

Wednesday, September 10, 2008

Double distribution profile

We did get to the globex high but we had price rejection today from the distribution above it. Couple of scale out opportunities and couple of adds. With a 10 point run to the high. I'd expect the market to attempt to rotate to the upper distribution of this double distribution formation. We might get a hook low tommorow before an attempt. Caution is the word. Very nice balance today. We did not see any major short covering either and it lends to the fact that a lot of the down move has beed aided significantly by intermediate/longer term long liquidation rather than all new shorts below the 47s. Will look at the COTs report to confirm that. If we rotate above to the upper POC we should see some swift covering. Theres unemployment news to watch @ 5:30 EST and financials as well as housing sectors are worth keeping in peripheral view.

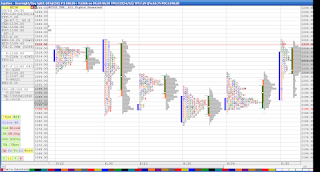
Heres the daily and weekly distribution as well as monthly.


The perspective at mean


We are in the F period. What is significant is the bounce of the low took us from 17-20K net negative delta on big contracts into positive territory here at mean. Overall market is still - 42k.

The long opportunity off the retrace to the VWAP is getting a little profit taking. Volatile in spurts and the mean could mean consolidation here for some time. Lunch time just around the corner.

Oh yes. At the bottom, notice we made lower low. However, quite buying (controlled buying) took out the -ve delta from -17k to -11k right before the hook (the sucker play to the downside). The hook is sometimes needed for propulsion. Notice the late shorts bailing quickly adding fuel to the move as they got caught in a hole. This is a different picture again from yesterdays break of the 47 area.

Above the mean, we need to be able to facilitate business above mean at 30.75 with increasing volume ( not yet evident) to be able to test the hod and possibly globex high. We have resistance galore above 36 area.

Todays IB had a good short opportunity at the overnight VAH, both in the A and B periods high, after the dominant flow @ 6.36 AM to the downside. It made those highs with a net -ve delta.
So far we are balancing around yesterdays value. I had expected a steeper drop ( a hook) than what we had so far before we retrace some of yesterdays value (the notorious 80% rule).

Tuesday, September 9, 2008

What a difference a day makes


Notice yesterdays profile and compare that to todays. Not very dissimilar at the surface for the first half. We did open above the value area. Until the break down right before lunch I personally heard a pundit ( someone who is very well respected) assert that yesterdays lows will hold with quite a bit of confidence.


What was different today? Well first, it was a completely different market. the IB did an open drive to the downside like yesterday. Narrower IB (relative to the day before) with the dominant flow to the downside. However what was not visible in the chart and profile was the mood of the market. We had a double reject of the dominant flow during the IB. But the price rejection from the B period high was much stronger and the buying at the A period low. The mood began there. My trades got chopped a bit as well . The break of the IB low and range extension in the C period was a good entry with the dominant flow. At the low of CDEFG periods however there was a big difference in the mood (vs. yesterday). We were -20K delta in the big contracts, -50K in the general chart and failing to make higher highs. Read yesterday's post and see the difference. The retrace of the H period was a great high probability opportunity to the shortside. The same level that had the high confidence long trade had become very vulnerable. It did take a while to break that level. The news of Lehman's failed buyout talks took the financials down the toilet.

Monday, September 8, 2008

The importance of holding out


I did not short the VWAP opportunity @ 7:45 AM today nor the IB high. Partly because my brain was still foggy;-). But mainly due to the overnight sentiment. After the the run up and the volume in overnight trading I was less inclined to short. Matter of fact, I had the opposite bias. The selling during the initial balance was very intense after 7:45AM. However it was quickly reversed in the big contracts chart. Though not as evident in the general chart. This is why following the big money is so important.

The best opportunity personally was the the low @ 11:01. Here the trin was markedly divergent, the big contracts were net positive at the low. Two extremely important factors that lent confidence in entering this trade.

This was a 20 point trade with an add opportunity @ 12:10 timeframe near the 2nd std. deviation. Arguably in my opinion, the best opportunity of the day. Will expand on that more in the next post.

Friday, September 5, 2008

Buying a high for a higher high


I missed the long trade at VWAP as I was buying some stocks for investment ;-).
I dont personally like this trade but serves as a great example for tape entry.
Its all based on the orderflow.
Price fails to make a reversal. Every attempt to sell has been halted by resting bids.
Finally there is a big order to sell (3K)(11:41 bar with chart filtered @ 100 contracts above) that gets absorbed and more important an initiative lifting the offer of 1.5 K and 1K orders (see tape on top). A combination of events that gives you a very high probability entry for a quick trade. Flow with the bigger money.

The ominous resting bids


The chart below illustrates the buying at resting bids that got reloaded @ 30.50-31.25 (10:05 pst). Trade yields a 3 point scale out so far and stop at BE. Notice the increase in volume and sustained bidding. Price is now trying to break above.

Toping for a possible rotation


Nice little weak pullback. Opportunity for a short. Keep in mind. The bigs delta is 20K positive and we have come to a delta neutral overall. There is both covering and and moderate bargain hunting. We are very close to mean and might consolidate through this area. After lunch might bring some decisive direction. Place for a very tight stop personally. If the orderflow continues to be on the buy side, additional covering will bring us inside yesterdays range. Its important to rotate and break through the 30 level. Notice that the G period extended IB and the weakness needs to build for a reversion trade.

Price at VWAP and mean


Price has come up to VWAP with a little buying by commercials.
The 100 contracts filtered chart has turned a +ve delta (7K). This makes it a dangerous selling at VWAP. The general Delta is still about -16K negative. So bigger money is slightly on the buy side (mainly covering). Mean is at 1224. With dynamic mean shoing a little shift upwards. So far it seems we might balance.

Thursday, September 4, 2008

Dominant flow at a key level


Todays action was very unorthodox. After the non-farms payroll got out @ 5:15 we got an early reaction, the unemployment claims came out as well @ 5:30 we got a reversal of a test of the 1272s. The dominant flow came at 5:45 and 6:11 to the downside which led to the test of the 62s.

The s&P500 opened right outside of value to the downside. Which was ominous. What surprised me though is the time it took for the sell off or a retest of the 62s. 6:48 bar got us the dominant flow of the IB. The lack of follow through was deafening. At that point I was thinking that a test of overnight high was possibly in store. Peter Steidlmayer, proposed the market profile with each time segment as half hour blocks. His reasoning was that this was about the time needed to gauge a true reaction of the market. It took substantially longer that that today. If you took a short at or before the open, it was one of the toughest, mentally. Especially since the low seemed to hold for a while and you are shorting against a key level that we have talked about for ages. However, the drying up of the buying interest at the 6:57 bar was a clue to the resting offers and soon enough the paper came in on the down side. Total Delta was -23k.

I failed to point out yesterday and post the 3 day profile which had an increased TPO count to the bottom of the distribution and it indicated a propensity to break to the downside. However yesterdays buying towards the close was convincingly deceptive and it brought it back to the days balance. This is why we need to adapt to a new reality everyday. Yesterday was a hook day. The macro news breakdown possibility that I posted came in the non-farm payroll and unemployment books. The open call right after the news at 5:15 AM pst brought it outside of balance. It created a new forcing point with which longer term participants have to view their inventory or the lack of.

It lead to a sustained and controlled, yet convicted, selling once the 1260s level was broken. Technically, the reaction at the current level of the 30s and potentially 1200s will be a key indicator of where long term participants see value. Todays auction as it stands remains incomplete.

Watch out tommorows non farm employment change report and unemployment change at 5:30 PST. It is going to be well read by all timeframes.

The trades at IB today were the hardest to take and toughest to hold at IB. The best oppurtunity was a VWAP and price never tested the vwap for the rest of the session.

Wednesday, September 3, 2008

An important non event day


In my blog I would like to focus on things that my readers find useful or new. You all know what the indicators are doing in the daily and hourly charts so I wont repeat it for you. One thing though, we are testing the 50-day moving average on the daily chart. We had a good test of the 1260s. The chart above is monthly profile. Notice the TPO count vs. prior month. How crucial the 67s have become and profile still points a higher potential break up. Compare this with the chart in the bottom. Same story. You see the significance of holding this level. We are still within the short term balance.


Now back to today. Frankly, I like the volume and response today. It seems to me that the overall sentiment for the longer timeframe buyers have not yet changed. In other words we are still inside the forcing point threshold.

If you noticed todays profile being built. There was an embryonic double distribution sell off in the beginning half of the day. H period reclaimed the single distribution structure and the buying continued enough to erase out more than 30K of negative delta. So while price ended up doing - well not much, The buyers did come in and some major shorts were covered.


So unless their is a major sectoral breakdown. We have a good probability of holding support. However from a price action standpoint we are at a very crucial point. We need to break the resistance of 80-84 level and retest the 1290s. The price rejection from the 1267 area has been so strong that any break down through the 60s may be violent. It can more likely establish a double excess low (double bottom) that is a healthy technical bottom for a potential reversal. That is almost obvious. But the second wave of the economic downturn has just begun to be quantified as measurable data. Although most of has been built in, any new surprise in either macros or geopolitics is going to be very ugly. Take a peek at the hourly 3lb chart below.


What might be in store ? Well if we open above settlement and settlement is bought during IB, there is a good chance of a good test the 80-84 level covering the single tail there. and if we can do that without a dominant flow reversal, a quick test of the 90s is in store. However based on the price action and where the value is, a balance day is more likely if we open within range and value and make a wide IB like today.

Trade wise today was a small loser on the ES. Did not short the IB or C period because it did not give me a setup, although it was a very good short setup if you short VAL as it opened below VAL. The loser came from my short at VWAP which got chopped (was first profitable before the greed machine came on) with the ying yang. It eventually went my way before the true buying kicked in. Anyways should have gotten out at entry as Beige book was coming out. Did not. Note to self.

Frankly, I was busier in my CAG short which was beautiful. Great risk reward too. Was peaceful a trade as perhaps ice fishing. Nothing like the seesaw in the ES.

And finally the masterpiece of a 3lb daily chart below. No other chart can draw such a long story in so many words. Again, spells out the significance of establishing a good support here. BTW, which longer term of the longer terms are trading this chart? ;-) Puts everything back in perspective of the time frame universe. There are again infinite time frames. Good trading.

Tuesday, September 2, 2008

Double Whammy Tuesday


A complete breakdown of structure from how the morning started. The dominant flows got reversed by the ISM news which showed shrinking factory activity trending towards contraction. Secondly, the hurricane Gustav good news was completely overshadowed by Hana and others that might follow.

The trade opportunities today were- B period short opportunity after the reversal. And a beautiful short opportunity at VWAP. There was another short opportunity at .382 retrace @ 10:40 PST (which I did not take). I just had the VWAP trade as winner. My B period trade got scractched on the pullback. I did take a long at the 85.75 level which got stopped at entry after a 3point scale out. That was the reason for the missed oppurtunity @10:40 pst ( you miss the train when you are riding the wagon).

It was one of those days where the retraces were shallow. Very difficult to read during the IB. Who knew the trade you scratch would be a 30 point winner. The key to the sell off read was what the big money was doing (orderflow) - reversal of dominant flow @ 7:12 pst. More importantly, how the news was received, crude oil and hurricane related news. Of course energy sector, and tech was a drag all day. It was a day if one was not in tune with the news and orderflow, would have had a bullish bias until it was too late.

Multi-time frames involved in the sell off. We have rotated 3/4 of our balance area (short term) in one day. The 63 level retest is just 10 points away.

Sunday, August 31, 2008

The importance of a good start

In sprint race, swimming or any speed sport, the start is one of the most important part of the performance. I have begin to realise that as a trader it the same. The first trades are mentally the easiest to take at least for me. My losing trades are statistically more concentrated in the starting trades as well. In the majority of days I find myself in the zone after the 1st trade or couple of hours of watching the market action. If you take 3-4 trades a day, its like in a 4x100m race, where would want the starting sprinters to get you in comfortable lead to build upon - or at the very least not be far behind.

That's one of the reasons why I like to trade after I get a good grasp of the structure, bias and type of day. The initial balance gives you a good introduction to the day that might unfold.

Friday was profitable day for me, netting me my average profit. It was however, not an easy day to start with. I had the notion that we might balance based on where we opened and price action preceding market open. The 3 line break chart gave an indication of a low volatile day, the .75x3 Pnf chart indicated that we were flat lined to downside based on the moving average. I don't trade setups on these charts but they are a good barometer, that takes away the noise of time.


I took a long in the E period based on order flow. As I did further research,
it was a trade that could have been taken but not the good quality (refer back to news etc. -consumer spending higher) and frankly better stayed out and waited on a direction. However the most important thing about trades like these is that you have to manage them very conservatively. Then came the news on income which was the lowest fall in 3 years. It was a profitable trade that instead of scratching at break even I let it stop me out, as the selling momentum went from a trickle to more desperate short terms getting out.

The interesting thing though is the effect of such a trade on your risk management and trades for the rest of the day.

I took a long in the F period after the news was absorbed and the selling dried up (dry up volume) and price found temporary support near DBY VAH. It was a half sized position (more conservative mainly because the buy response had not been seen yet). The order flow favored a retrace and when it initiated, I tightened my stop further. I took my profit near VWAP.


Now I recouped my loss and slightly in profit. I was looking at VWAP as possible shorting opportunity. But VWAP generally is close to the dynamic mean (which means chop). Finally the price is here where I want to get in the direction of the sentiment. The big contracts are delta more delta negative and the general market. Everything is lining up.

However I didn't want to end the day in a loss since the week's been descent. I entered 1/2 size short position 1 tick below the VWAP (90.75) on a down tick. Price went in my favor and then it stopped me out at even (generally mean requires a bigger breathing room). I reentered again when the general market parameters lined up again at VWAP (90.25) on a half size. Now under normal circumstances it would be full sized and perhaps an add to the position soon after follow through. I used a conservative strategy for the add as well.

I had order for 2 contracts add on a sell stop at 87.75 which was the swing low of this inverted M formation (double top). The reason is that the bailing out of late longs from the swing low often provides a momentum to the double top failure. However, due to the price action, I took out 1 add at entry (87.75) as it came back to me(again a conservative step). Took profit on another at 85.75 (preservation of profit) and I was all out at 83.75.

It was almost a 10 points move on which I got less that 1/2 the possible profit (all contracts). Simply because I let my guard down on the first trade and switch to conservative hat. Now this last trade was the best trade of the day in my opinion unless you shorted the 96-97 during IB. Like all good trades, it was the toughest to be in. The effect of a bad starting performance is that it puts you in a survival mode which restrains the rest of your trades working to full potential. Now, I have added to my strategy to be mindful to treat the first trade as the first sprinter of the 4x100m and focus on profit or breakeven.


Thursday, August 28, 2008

The Trading Dilemma Zone.


Imagine you are driving in a car, talking on the phone or pondering about something.
You are doing 50 miles an hour in a 40mph road. You are about 100 yards or so from the traffic light just as it turns yellow. Do you speed up or do you hit the brakes... that was a scenario I heard on NPR about a month ago on the program on the traffic dilemma zone. It was referred to as the dilemma zone for brain where it has to make a split second decision whether to make it or stop. I caught maybe 5 minutes of it so I cannot elaborate much. I cant find the recording either. I suspect at that moment the motor cortex takes over control on the decision. It calculates if you are going to make it or not, based on the visual information it is receiving. I think this is much simpler primal process but a good comparison to what we encounter everyday in trading.

Now imagine you are about to enter a long position today in the E period today. You have been waiting for a retrace all morning so you could get on the train. However, instead of a normal retrace, the market makes a steep dive down to approximately your level. You have been analyzing the rest of the markets, news and parameters to see if anything has changed to the long bias - it hasn't. But at the moment the price makes a steep dive to your entry location, you are in a dilemma zone, I suspect. I have fear that the momentum may take it further through me, perhaps the next major level. I have greed to be on the train.


I wrote my premise of my trades and bias today in my last blog. Again to recap. The market makes a strong open drive during A period opening above POC, value, range and the previous levels of resistances. The opening price is bought up on subsequent periods. Strong delta, strong big money delta as well. Price has stopped at strong resting bids @ 6:55, 7:11, & 7:28. Dominant flow is the first 2 bars (reversal of selling pressure). Then we have another at 7:56.

I entered my bid at 1289 at the 8:44 bar after it ticked up from the low just as I notice selling pressure subside significantly and a big block of order trade on the ask (confirming the show of hands @ 7:56) . It was VWAP as well. But by the time my bid was on the dome the market was at bid 1289, I was fighting the market already. I did'nt take the ask. I had maybe less than two or three seconds to take it. I wanted that tick. One of the main reason was that I wanted to stay at the bottom edge of the initial balance and give it a 2 point stop intially, then switch to a mental stop. But I think the bigger reason was because I was mentally in fight mode already. It is what I am calling the trading dilemma zone - when you make a decision to enter a trade. However I think there is a lot more involved to it than that. I don't remember being afraid so much as unwilling to take a higher price and then soon enough my unwillingness to chase (self trained) kicked in. In a matter of couple of seconds the time place opportunity was gone.

I would pose this question to Dr. Steenbarger and see what has to add on how to deal with this zone mentally. His blogs on trading psychology has been of great help. On the managed exit side of things there are couple of good articles
They are similar in nature I suppose yet need different strategies.

I did end up buying the 1st standard deviation of VWAP at 1294 in the J period for a much smaller trade. I thought I was lucky to get that retrace ( see prior midday update) because on days like this retraces can be very shallow. I did end up taking profit earlier because I caught myself dozing from the flu medication at one point (that much action today). I figured they don't let u drive (a much simpler activity) under medication, I might as well as preserve the profit towards trading costs and stop trading.

It is important to me to get the first great opportunity so I don't have to take a make up trade. I would rather be adding than initiating. I hope nobody took the short side of the market today. I posted the advise against shorting today from my well ingrained traumatic memories stored in permanent memory in my brain.

Trend day


I wanted to post the chart above last night. Unfortunately, I passed out after a good dose of Flu medicine. Thanks to my kids daycare we get it from time to time. Thats a part of parenthood. Lots of ginger water, citrus and coffee and a wait out period.

Trend day so far. Open way above value and range (big gap open). And support to the bottom of open range. Notice the 4 point IB. These days are dangerous on the wrong side. We still have some shorts caught. The afternoon may bring further range extendsion if we can hold the 92 level. I put in an order long at 1289 after the E period low. At the same time I noticed a large block trade at ask. Never came to my bid again. I hope some of you caught that. That was the trade of the day to scale out the rest of the day. Good trading. Whatever u do. Never, never try fade the expanding edge of a trend day. The day looks dull on the surface. But days like this has a potential to explode. Did I say never fade this kind of day? I would rather be wrong than hanging upside down.

Wednesday, August 27, 2008

The day in review - top heavy


Heres the Profile for today and clearly we have established value higher. However it has a topping formation meaning price rejection as of now above the 85s.

Look at the order flow at 9:53 pst. 1285 had a big amount of resting offers that got reloaded. Then they hit the bids too pretty heavily. There weren't enough timeframes involved to break the level yet. It was a good short opportunity on the second attempt. I did'nt take it though.

How big is the timeframe universe

The buying at the 60s should not be confused as a signal for a bull market. In fact the very long timeframe, long, intermediate and short price trends are all down (intermediate/short term value is headed up slightly - see monthly and weekly profile). We do have a price rejection/support level in the short timeframe (although it has become a little porous after yesterdays action). And this support is provided by the participants who are outside the balance area of 1290s to 1260s. At the edges they play depending on their inventory. Now are they the same players every time- no. Are they all long terms - no. Will they bail when the level is broke - yes and no. Will they scale in if get to the 30s - some definitely yes. Some may be short and cover. Some may not until they find another attractive level. In the 30s we will encounter a new set of players some of the old and some new. So the timeframe universe is like a video game where advancing to a new level brings new players and new foes. The short time frame trend is flat lining. But whether its the 1200s, 1230s, or the 1260s the first embryonic conception of a market turn appears in the undercurrents just like so. And while the level is not significant as the turning point, it is the behavior of the market that has transformed in the last several weeks. Whether it will turn at the current level or not the is really not predictable and nobody really knows. What is predictable is that the journey will take us through many mini-balances like last week and this week. It is within those balances is where we play. An awareness of the boundaries and potential behavior there is what is paramount for the day traders to keep ourselves from being sucked out into thin space and our accounts with it. Remember we do not have intermediate and long term initiative buying quite yet which will bring us the volume and perhaps out of the balance. The same thing can be said of the sellers .


A thousand Qin Dynasty Warriors

The S&P 500 emini contract opened today slightly above value. It goes on to test POC and you will see the response in the order flow. The significance of the 1268 area? weekly poc, monthly level, daily level. The daily profile below looks to me like Qin dynasty soldiers with their spears pointed forward at the 1268 level.


This is a setup where you buy the levels. Price opens above POC and Value combined with the information that we have gathered from the market so far. A high probalility trade.
I don't strictly buy the levels via resting limits. I use orderflow and buyers commitment at those levels before I enter. I sometimes pay a price for that by getting a fill that is a few ticks higher.
Nothing wrong with resting orders - just depends on your risk manangement plan.

Now here's why I made a market comment days ago. Crude jumped $3. That has been a significant thing ain't it. But what happened today? Why did we not dump 10 points? That is why I said in my earlier post that market is never the same. More importantly, the players are never the same. We think visually that patterns are repetitive, not quite that simple.

We had two dominant flow attempts that was bought up before 7:00 PST. In fact by the 7:00 bar, the dominant flow prior had reversed in the favor of the market structure. The buy of the POC area was a great trade on this bar and if you trade lots of contracts, scaling that out the rest of the day is a good strategy. I was out in the 78 area. I reentered in the D period on a smaller size which I ended up scratching for a few ticks loss and reentered again in the E period at VWAP which was a good run. We should not expect much out of a low volume market. In fact that brings me to the next post.

Tuesday, August 26, 2008

The play of infinite timeframes


So whos buying the 60s and whos selling the 90s. Long term, short term or intermediate term? In my opinion its all of the above and all in between. There are levels though where certain players have more conviction, need for inventory or excess off and thats what causes the temporal balance. This balance migrates almost like a tornado shifting from pressure imbalances. And within these balances the respective players excercise relative control. Almost like taylors market cycles.

The dominant flow today occured @ 6:37 (there was one at 5:08 as well) and it was immediately bought up. That set the mood for IB until 8:40 pst when it sold off.
I generally dont get right on board in the IB, but my affinity to buy this level had grown root.

A dominant flow that gets reversed is significant at a support level and the bias is reversed as well. Especially if it happens during IB. I did not get a chance to enter @ the 6:37 bar as the buys reversed the delta to +ve. I did enter and scratch my trade @70 almost an hour later and seconds later it busted through the 72s. My bullish bias was the buying at support and subsequent orderflow. Very brief trade looking for immediate follow through. The 8:40 bar shifted the bias and it took the next four hours f0r the selling pressure to subside.

The involvement of the mutiple timeframes was evident from premarket tussle, to the IB reversal and as we extended the IB range in both direction. The balance area though drew far less interest and we ended the day in low volume.

Now heres the 2 day profile. It serves as the initial balance of the week. TPO count is 135/85 indicating higher probability for a rotation up. I am still concerned about the slight normal variation fattening the 63 area. Possibly suggesting that selling pressure through this level is mounting and value is shifting lower.