Friday, August 22, 2008
Is it raining or cloudy in Chicago?
Its 77F and raining in Chicago says google. So maybe they left indeed. Wait a minute, wundergournd.com weather says mostly cloudy (not raining). Intellicast says 81F broken clouds - thats nice. Remember, they have very few days left there before it becomes a block of ice. Most locals must have left to enjoy the last few clouds.
All buyers are not equal
Yesterday morning I posted a chart that is filtered on 100 contracts of more.
It showed an overwhelming skew of trades on the buy side vs. the comprehensive market volume analysis which included the public. We had a lot more buying on the commercial side then the public. Today there are more public buyers then commercials. We are delta neutral on the commercials and we have a net delta of about 19K on the trades less than 100 contracts . So unless the commercials show up we might be unable extend the range much further. As far as shorts, that is off the table for me right now until we see the selloff like we saw @ the 90-91 area (8:00 AM PST bar) from the commercials. So far the commercials has been quite since 8:00 pst. Currently it feels like we have no paper. Is the pit half empty?
Below is the volume for contracts above 100.

What is not happen yesterday and today's profile
We have seen yesterday's bullish profile below. I thought it would be interesting to discuss what did not happen. We opened at VAL and was immediately bought up. It was very interesting to me that we did not probe below any recent lows (on pretty negative start and news). The 64-67 area was of interest to a lot of buyers and the commercial buying as shown in my filtered chart yesterday continued throught the day. In fact right after my post it went to make higher highs. From a trade perspective I had a long in the C period which I exited all out too early. And two shorts that took back a large portion of my profit.
Yesterdays dominant flow was indeed too dominant as was already evident in my post. I have noticed this time and again(but I am always surpised by it ;-))that when the other timeframe grabs clear control of the market, they are generally not deterred by short term news. My sense that the market might come to its senses and the weak longs bail (which is the reason why I exited early), did come true. But the weak longs simply sold into resting bids who were buying for a different time frame. The buying in the futures markets managed to pull the equities markets up.
In retrospect, here's the lesson I learned from yesterday. When you exit a trade too early. It causes you to enter into semi-revenge trades. Although I had thought I dont take revenge anymore ;-) the mind finds a way rationalize it (especially if price lingers at a level too long). You start getting visions of the future.
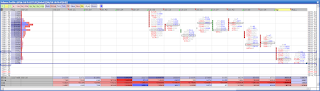
So here is today's profile so far. We gapped open higher well above value.

There was a a nice trade entry in the F period low and with oppurtunity to scale out as we semi-stalled in the I. I have a little runner to manage the rest of the session.
Todays dominant flow in the IB came in on the buy side. In the bid ask analysis below, the 6:50 bar got the first wave of paper in. And the 6:59 bar sell off was absorbed into the resting bids.

The PNF chart below shows where we have been flat lining. The PNF or point and figure chart is a great tool to understand what the price is trying to do. In fact it is the genesis of the Market Profile charting. It takes out a lot of noise in the traditional charting systems.

Yesterdays dominant flow was indeed too dominant as was already evident in my post. I have noticed this time and again(but I am always surpised by it ;-))that when the other timeframe grabs clear control of the market, they are generally not deterred by short term news. My sense that the market might come to its senses and the weak longs bail (which is the reason why I exited early), did come true. But the weak longs simply sold into resting bids who were buying for a different time frame. The buying in the futures markets managed to pull the equities markets up.
In retrospect, here's the lesson I learned from yesterday. When you exit a trade too early. It causes you to enter into semi-revenge trades. Although I had thought I dont take revenge anymore ;-) the mind finds a way rationalize it (especially if price lingers at a level too long). You start getting visions of the future.
So here is today's profile so far. We gapped open higher well above value.

There was a a nice trade entry in the F period low and with oppurtunity to scale out as we semi-stalled in the I. I have a little runner to manage the rest of the session.
Todays dominant flow in the IB came in on the buy side. In the bid ask analysis below, the 6:50 bar got the first wave of paper in. And the 6:59 bar sell off was absorbed into the resting bids.

The PNF chart below shows where we have been flat lining. The PNF or point and figure chart is a great tool to understand what the price is trying to do. In fact it is the genesis of the Market Profile charting. It takes out a lot of noise in the traditional charting systems.

Thursday, August 21, 2008
A futures driven day.
Market was dealt the wrong day ( as far fundamentals & news) for a range extension to the upside by the longer timeframe players. Nevertheless, they found a way to do it. The day type so far is the normal variation of a normal day. We have found ourselves now all the way from the low value area to 1.8 times the initial balance. It was a rally led by the futures market.
If you noticed the market parameters, the future market dragged the Market Trin with with (in other words, the equities had no choice but follow the futures market). The futures rally off the lows was fairly broad based. It was clearly a day when longer term players took control of the market.

If you noticed the market parameters, the future market dragged the Market Trin with with (in other words, the equities had no choice but follow the futures market). The futures rally off the lows was fairly broad based. It was clearly a day when longer term players took control of the market.

Where is the big money playing today?
Nothing significant so far. Quite surprised on the contrary that some of the big momey has been on the buy side like yesterday. Some intermediate short term covering. Not much action. With crude making big gains, and weakened dollar. Watch out for any sign of inflection point with further weakness in dollar.
Heres a new view I am introducing. From time to time in the day I make the 30minute chart with a filter of 100contracts or higher. It gives you an idea of where the bigger money is flowing. So far we @ 26k positive delta. Which is a very different picture from the general market delta @ 6K or so. Again thus far.

Heres a new view I am introducing. From time to time in the day I make the 30minute chart with a filter of 100contracts or higher. It gives you an idea of where the bigger money is flowing. So far we @ 26k positive delta. Which is a very different picture from the general market delta @ 6K or so. Again thus far.

Wednesday, August 20, 2008
Trading tools and the Palm Treo
My Palm Treo 650 was part of my trading tools and now I miss it immensely.
This is how I used it. I have sprint as my wireless provider and have their unlimited data plan. I used the Treo as my backup connection in case the DSL went down. On at least 4-5 occasion the Palm's connection has bailed me out flawlessly. At least on 2 occasions I was in the middle of a trade and was able to manage it through my Palm (most charts on as well). I use a third party software to use the data connection. Ever since the timely demise of my Treo I have my dial-up ready but really not comfortable with it.
Now I had a big misunderstanding of Sprint's new deal and I have cancelled my 800w at least for now. I feel like I was misled a little. So for now I have activated another phone and until my upset state of mind come back to balance;-).
But from a trading perspective I think it will be cool to have a backup on their faster network. Sprint claims 350-500kbps upload and 600-1.4Mbps download. I like Palm and hope they would survive as company. They need to deliver on their promise of cool new things.
Having a nice backup is important. Dial up doesnot really cut it I think though it will get you out of a trade. Especially if you are like me analyzing tick by tick volume at entries. Hey, maybe I should call Sprint tommorow again!
First here's the morning buy response in two waves.

And the 3 day profile. The 3 day profile is a good tool for the day trader. Since the Market spends 70% of the time in balance, it gives a good picture of short/intermediate term value. I mentioned in a previous post 3days ago ( @ the upper balance) that the market was exibiting increased TPO count below 1298 area and it was likely to balance downwards in the short term, althouth the longer term profile (30day) was in the opposite direction. We now have a b pattern indicative of some price absorbtion and skewed TPO count of 268/137 above POC indicating a possible rotation up within the balance.


And the 3 day profile. The 3 day profile is a good tool for the day trader. Since the Market spends 70% of the time in balance, it gives a good picture of short/intermediate term value. I mentioned in a previous post 3days ago ( @ the upper balance) that the market was exibiting increased TPO count below 1298 area and it was likely to balance downwards in the short term, althouth the longer term profile (30day) was in the opposite direction. We now have a b pattern indicative of some price absorbtion and skewed TPO count of 268/137 above POC indicating a possible rotation up within the balance.

The factor of dominant flow
When I miss a big trade, my mind tends to be in the chase mode. I try to be conscious about rationals behind the next trade. By 10:55 the ES was having an increasingly difficult time facilitating business above yesterdays value. While I entered the next trade @ 10:56 based on order flow (higher highs but -ve delta), thinking that there could be a normal variation to the downside of the balance, I was not sure if I had entered this trade in chase mode. It was almost exactly at that point that the Trin make a big spike and validated my rational to stay in the trade. It was like a gust of tail wind right after you took a tee shot.
The important point here though is the target. The sell off was impressive but a slow grind. My entry was 68.75 which was near the I period high but not the greatest location. I got a lucky tailwind. My constant scan for any ground breaking events did not yeild much except for crude making modest gains. Initially G period low was the target for a scale out, but the orderflow gave the oppurtunity to stay. in. I set the second target at above LOD. I then remembered the buy response in the morning and took all the contracts out @ 4.75 pts when we failed to break and the odds of a balanced day increased(see the big trades at bid but price stagnant). The trin did not make any higher highs as well. It turned out to be a good decision as it also allowed me to enter at the edge for long trade that yielded 6-12 pts depending on how long you stayed in (6 for me)

The point I wanted to share is - remember the dominant flow of the day ( especially intial balance) and use it in the analysis. Secondly, dont be fixed with a target if the kind of day cannot offer you one. The target depends on the kind of day it is, as well as where your trade is located.
Missed trade and the chasing mind
Todays balance was somewhat predictable but the open action was a little surprise. Open is not just about open calls from institutions, or paper that comes in. The lack of paper also allows the locals to play a bigger role then just execution. The sell off in the morning was more local pushing based on the volume, than paper. Especially if you look at the distance travelled and sell volume. The 1260 area was a good place to grab any stops from yerterdays lows. The buy response that took us from the lows was mostly covering and some buying but the real buy response came at yesterdays POC area of 67-68.

That buying brought us from the nearly neutral to 35K Delta. Now I was interested in the 1277.50 area for a reversal to current balance. It made a probe @ 8:13 PST and never got a chance for a second weak probe. It dropped quite steeply @ the 8:46 bar and personally it would have been a chase to enter 4-5 points below intended entry. But the key thing for me in this trade was location because of the strong buy response, the delta etc., if you want to short, you want a really really nice location and a good sign of potential weakness.
The sell response was equally impressive and by the time we got to the mean (bright gold spot in the Value bar) we were nearly neutral. Overall market was weak and the ES made its attempt to break to the upside of VWAP. There was a scratch trade @ VWAP (short) as the lack of follow through gave me no reason to stay (Fat part is the choppiest part). 10:24-10:55 made new probe highs but the dominant trade was on the sell side as evident in the delta below. The two trade that followed was extremely interesting. This was a small trade but an important point here in the next post.
Tuesday, August 19, 2008
Open Oppurtunity & Delta Divergence
Heres todays profile and right off the bat you see the difference in todays open versus yesterday. S&P 500 opened outside of yesterdays range and went to test the value area. It got to overnight Value area low (VAL). Two important things, it could not get to settlement, and it could not test Day session VAL. A nice trade strategy is a short as it falls through open price. C period presented a nice oppurtunity to short at the confluence of both the open and the VWAP. There was another short at vwap in the G period which was a stop @ entry. I period presented another great oppurtunity to short the open.
Lets look at the open closely. I don't generally enter the cross of the open because of my risk management rules. I am a firm believer, that some of the most profitable strategy may not be right for you based on your risk management goals. If you entered the cross of the open as price went to the downside in the 6:44 bar. If you had a 3 point stop, the 6:45 bar takes you out. Now some may say 3 point stop is too small or too big. It is neither, because we do not know the possible range yet.

If you trade the open or IB, today's best open entry, in my opinion, was the 6:45 PST bar. We had the open test drive at 6:39PST and a moderately strong reject indicating some paper on the downside. This was not a strong show of hand (until 6:50). Nevertheless given yesterdays close (which was an incomplete aution ended by the lack of time), where it opened today (well underside of value and range), overnight activity etc. was a decent edge (not a certainty). So shorting a weak pullback gives you a decent risk-reward for the day. Of course the next bar, a lot of paper comes in and gives you an oppurtunity for an add perhaps. The second short oppurtunity came in the C period.

The third short oppurtunity in the I period was aided a little by the lack of buying and covering as seen in the footprint below. Its a 5 min chart showing bid ask volume traded at each price and cumulative delta in the bottom. The short in the I period had an oppurtunity for an add as well. This trade though tested your pain tolerance or the pain of the gain as coined by Dr. Brett Steenbarger.
However, given the structure of the day ( which was a balance day) and the fact that when you got to the bottom the delta was divergent, it was not a trade to let run. Note the total cum delta was more than when it was was in the E period LOD. This generally means we brought with us less shorts than last time. Notice also the high number of hitting the bids but price unable to probe lower. This generally indicates buying or reloading of the bids. It is a great great oppurtunity to exit (even if proven wrong) the trade given the structure of the day (balance). It is not quite by itself an oppurtunity to buy though. Soon enough all the late shorts bail with the day shorts and perhaps some short term shorts and price comes to today's fair value.

MP software and links.
Many readers have asked about market profile software. There are many but ones that have serious emphasis on MP are
- Invester / RT,
- Market Delta and
- windotrader
I use Market Delta with DTN feed. I use their bid ask analysis, PNF and the regular candlestick charting as well. I dont know of any MP course that I can recommend. If anybody has one please do so. There are many good reads on MP. Daltons' Markets in Profile, especially, I have read at least 5 times.
I think learning MP is like internal medicine. I consider myself an intern. Everyday, every mini balance, week, and monthly balance brings new learning. Its a lesson that will never be quite complete. I am a firm believer that the Market is constantly changing and is never again the same. Its human element part of the market that remains somewhat predictable.
End of the day Monday
I have been meaning to post the finale but unable to, my TREO 650 had a burial (still waiting for 800w). S&P 500 opened on a clear open drive ( the strongest of the opens ) to the downside. The volume was not big but the conviction was clear. One of the key things in MP is to go with the trend following a balance day. Here was the transition from Globex to CME in the morning

Many market profile experts take their position during the Initial Balance or the first hour of trading and then scale their positions out during the day. This is especially a good strategy on a trend day. The other strategy is to get on a retrace with a position in the direction of the trend. The ideal retrace came right at VWAP of the day or the high of the D period. Retraces like these are tricky in the absence of a strong level like vwap because it can just as easily go against your position. In those cases a PNF chart helps clear the noise.
I was looking for price to get to at least half back to the 98s which never came.

The S/R level of 1278 area had a battle for the rest of the day. The POC we have to remember is also the fair price. The longer it spends their the less action one should expect. It ended with a mild buying, selling then covering. That is the POC area for the last 30 days. It may not be visible on a bar chart but it is where we spent the most time during those days - at a price level percieved as fair.
What concerns me is the structure of the day which implies that the sell structure was broadly distributed down. Meaning that the other timeframe participants did not find it attractive enough to play (given their inventory, macro, geo-politics, stars alignment.. or what have you).

Monday, August 18, 2008
Expanded 30 day profile

An expanded view of the 30 day profile at POC. .25 resolution presents the POC as 77.50 -78.50 area although the high volume node is 77.25. Price has traded in this range for about 50 minutes.
Dalton's Webinar extra
Expanding on the take aways from Dalton's webinar, there are two types of trades. Go with/ and mean reversion. On trend days, one should worry about getting on the trend early not the location. On balance days however, one should worry greatly about the location ( you want to initiate trades in the edges and not the fat part or the mean area) Calculating risk-reward for each trade.
He suggests an exercise for EOD analysis where you can put red and green pins on a printout of the days profile. It will give you a visual idea how you are locating your trades.
He suggests an exercise for EOD analysis where you can put red and green pins on a printout of the days profile. It will give you a visual idea how you are locating your trades.
Today & now
Early today, during globex session, the ES traded up on razor thin volume. At the high the Globex delta was about 2k. Paper came in on the sell side on moderate volume. Housing data did not provide any new news.
Currently @ 11:01 PST. We have rotated down to the lower distribution and at the POC of 1278-79 area of the 30 day profile, a potential area of support. Any sign of responsive buying would provide an early clue. This area has been a relatively important s/r area. A break on high volume might take us to the next distribution below. Broad based weakness in the market. The fact that we have trended down from the current balance area is an important point that currently we are in intermediate /short term timeframe control. So the 78-79 area in my mind is an over-under level either for a continuation or reversal.
Currently @ 11:01 PST. We have rotated down to the lower distribution and at the POC of 1278-79 area of the 30 day profile, a potential area of support. Any sign of responsive buying would provide an early clue. This area has been a relatively important s/r area. A break on high volume might take us to the next distribution below. Broad based weakness in the market. The fact that we have trended down from the current balance area is an important point that currently we are in intermediate /short term timeframe control. So the 78-79 area in my mind is an over-under level either for a continuation or reversal.

Sunday, August 17, 2008
Which way is the elevator going?
I dont trade the initial balance (1st one hour) of the market. Mainly because my trade plan builds off the IB. I watch it intently for the bias and momentum of the paper that comes in. I laid out the comparison of the 3 day profile and the 30 day profile in my previous post and we looked at two possibilities at edges of the current paradox.
On Friday we went on to test the overnight high and was quickly rejected and the support of the 1291 area held. The market set it self up for a possible balance by the reject in the C period. D and E periods provided excellent trade points to ask the question - is the market doing a great job in the longer time frame trend or is the shorter time frame trend more likely. We had 30K delta ( barely) and the markets were divergent. Russell was well off the highs. The Trin was well of the lows. Nothing was on fire. I mean it just was not the day it was going to bust through the seams and break out.

J& K periods provided yet another opportunity for a reversion to the mean trade. I did manage to make a mistake in the middle of the distribution waiting for the trade, in spite of my plan not to trade the fat part. I got tired of waiting for the market to come down to the edges. I have named them the Amygdala trades or the fear of losing oppurtunity trades. Fortunately the market gave me an exit and I was able to snap out of the trade (at a smaller loss) and catch the edge. Overall the day was a great balance trade day.
The long time frame buyers I mentioned in my first post were noticeably quite!
Major League Market and the Market Paradox
I attended the tail end of a Dalton webinar which was excellent. (thanks to Brett's blog) for the listing. In that he brought out two things which I think was very important (I missed 70% of the webinar).
First, as any one of us start in trading, we play our first practice ( or real money if you prefer) game in the Major League Market (MLM). There are no pee wee leaques for trading, no high school or college programs. Certainly no minor leaques. We are hugely disadvantaged in the game. If I had accepted that fact many years ago, I would have just sat in front of the orderflow for years before I got myself a mouse to click.
So every day you walk away a winner (or a draw), you buy yourself a cigar (dont smoke it). Every week you walk a winner, treat yourself to the golf course. Every month you do so, take your family for a weekend trip. Because you have won against the system of the Ivy league graduates who are given all the training and resources in the world and a very very deep account. It is not neccessarily their money you've won, but you've played at the highest level. Every time you dont, prepare for game day (remember who you are up against). Wow ! this sounds like advice. Please remember, this blog is mainly note to self.
The second thing that is relevant to me as a daytrader is to always evaluate what kind of day it is and who is likely in control. It is from Dalton's books that I have begun to have an understanding of the significance of the day type and how to use it in trading. It is my understanding that knowing which time frames are likely in play during a days session is more important to the day trader than any other time frame trader. That simply does not mean volume of buy vs. sell but an overall picture of what is/is not affecting capital flow - macro news, currencies, commodities, bonds and a myriad of other things that affect the flow.
(I apologise for this late notice - but I am writing this blog strictly from a day time frame traders viewpoint. )
Elaborating on both the second point and my previous post on the current market paradox, we could ask - are we going to trend up (long time frame) or balance ( Short/intermediate time frame). If the market is not doing a great job at one than the other outcome is more probable, right!
Market and the Uncertainty principle
I have often wondered what is the closest phenomenon that compares to the market. I have failed to come up with an answer. It reminds me of the scene in one of the matrix trilogy where the collective mind is tapped into. In my opinion, Market behavior cannot be simplified to a process or a phenomenon driven by a collective mind. It is far far more complicated than that. The market is an uniquely unnatural phenomenon.
However, there a quality of the market that I often compare to something we learn in high school. Its the Heisenberg uncertainty principle in Quantum physics. The market is constantly efficient for one time frame and at the same time inefficient for other time frames. When we try to define price and value for one time frame, we make the price and value uncertain for other time frames. Although I think there are infinite numbers of time scales that factor in the market behavior, we over simply it ( for sanity's sake) to a finite group of participants.
In the prior half of building of the 30 day distribution ( as it unfolded) below, short/intermediate term time frame was in control and the value was shifting lower. It was uncertain when (not whether) longer time frame participants would see value. Now longer time frame has appeared and the value has shifted higher but the short term value is uncertain.
The 30 day profile has developed a spike in the top distribution indicating shift in balance range ( &therefore value) upwards, the 3 day profile however is showing increased Tick and TPO count below the 98 level. We may be in a longer term trend phase, yet the market is showing greater propensity to balance in the shorter term time frame. Cisco futures provides an excellent resource on the Meta profile. I am not a subscriber to his service but I see great value in it.

The 3 day profile below is drawn without Fridays (8/15/08) data and the tpo count of 85/130 indicates a higher probability of a short term balance then a break out. Keeping in our minds that we have increased TPO count and a spike in the highest end of the distribution of the 30 day profile ( indicative of a potential for upside breakout), one has to be ready for both outcomes. I think this is the traders paradox everyday - and the key to it is figuring out who is in greater control. Friday was one such day. and we'll look at it in the next post.

Subscribe to:
Posts (Atom)

